
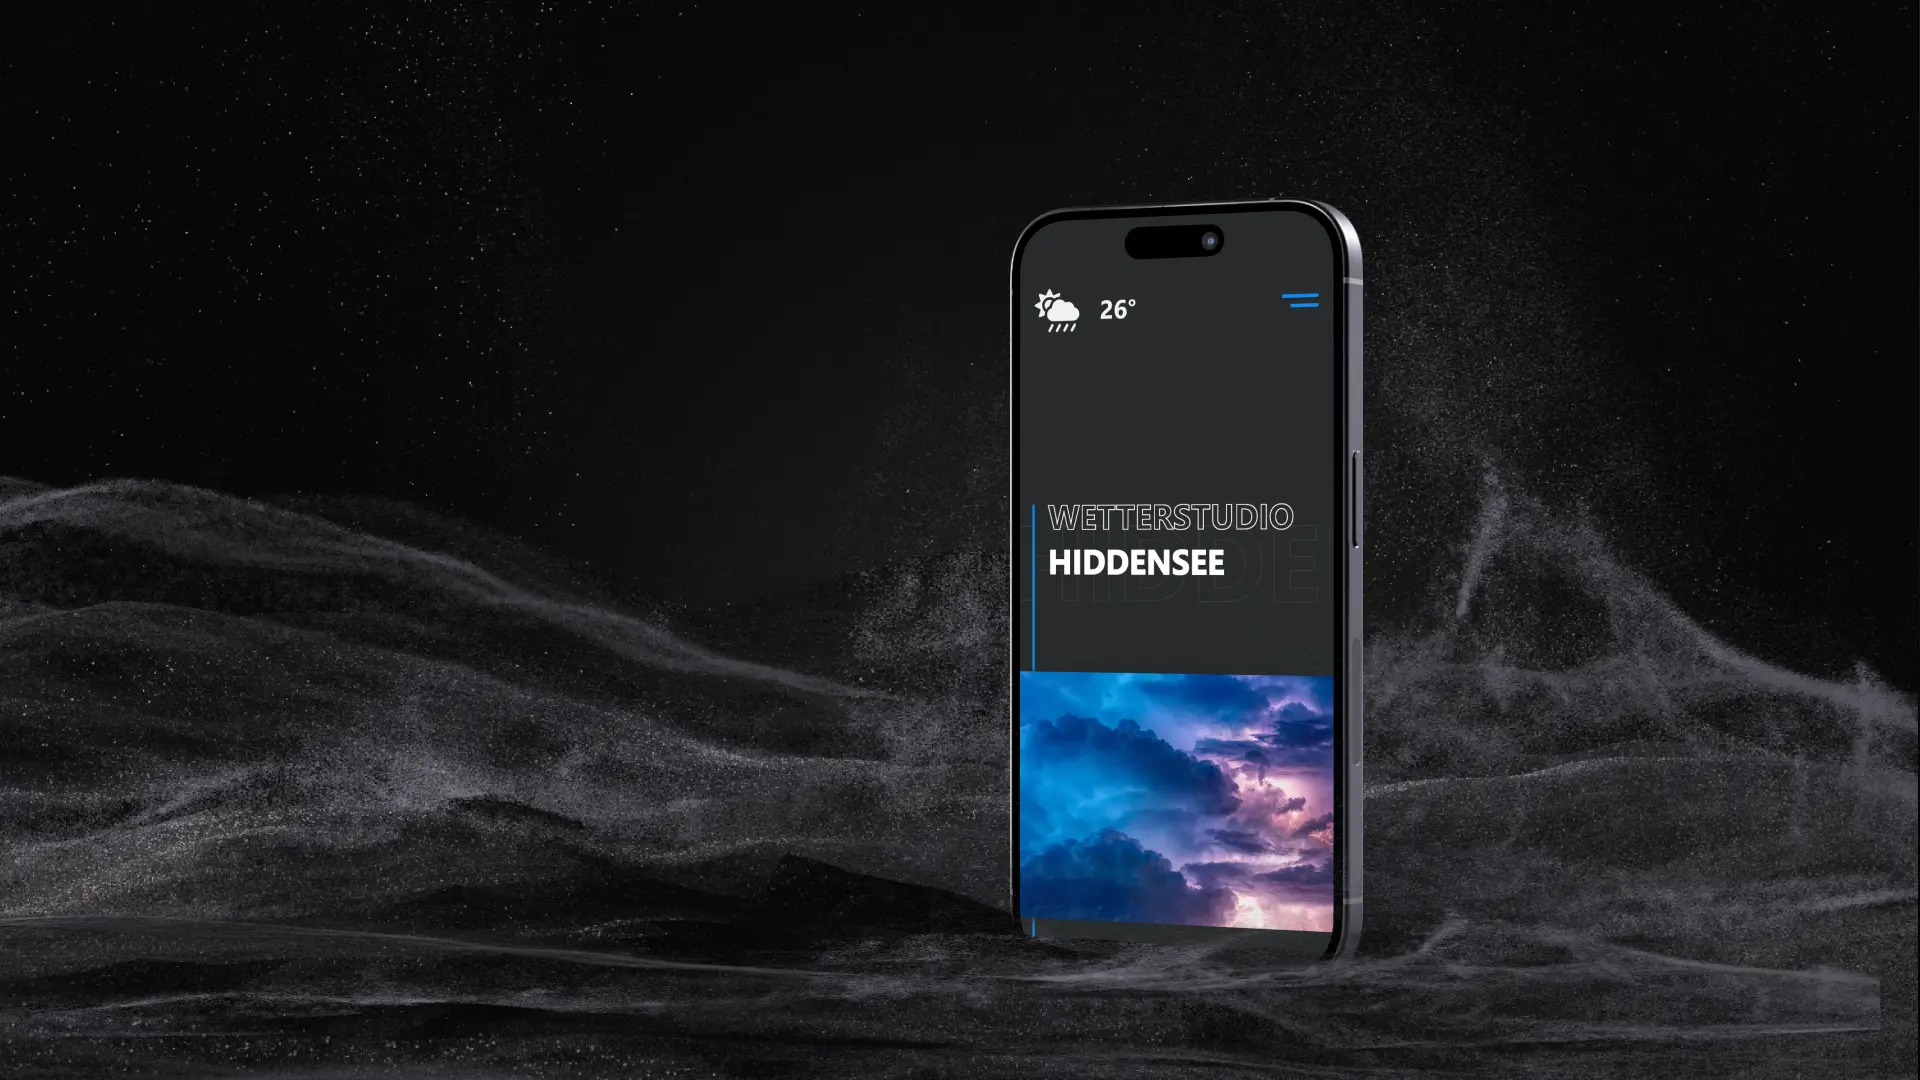
Cases / Wetterstudio Hiddensee
Data only matterswhen it helps people make decisions
As inviting as the island itself
Wetterstudio Hiddensee has been providing reliable local weather data for years. But the old website was as old as some weather instruments. Data was there, but hard to read. No mobile optimization. No charm.
12kDaily Visitors
4.2minTime on Site
100%Uptime
Weather is emotional
A glance at the thermometer decides between beach visit or museum marathon. That's why we didn't just visualize data – we made it experiential.
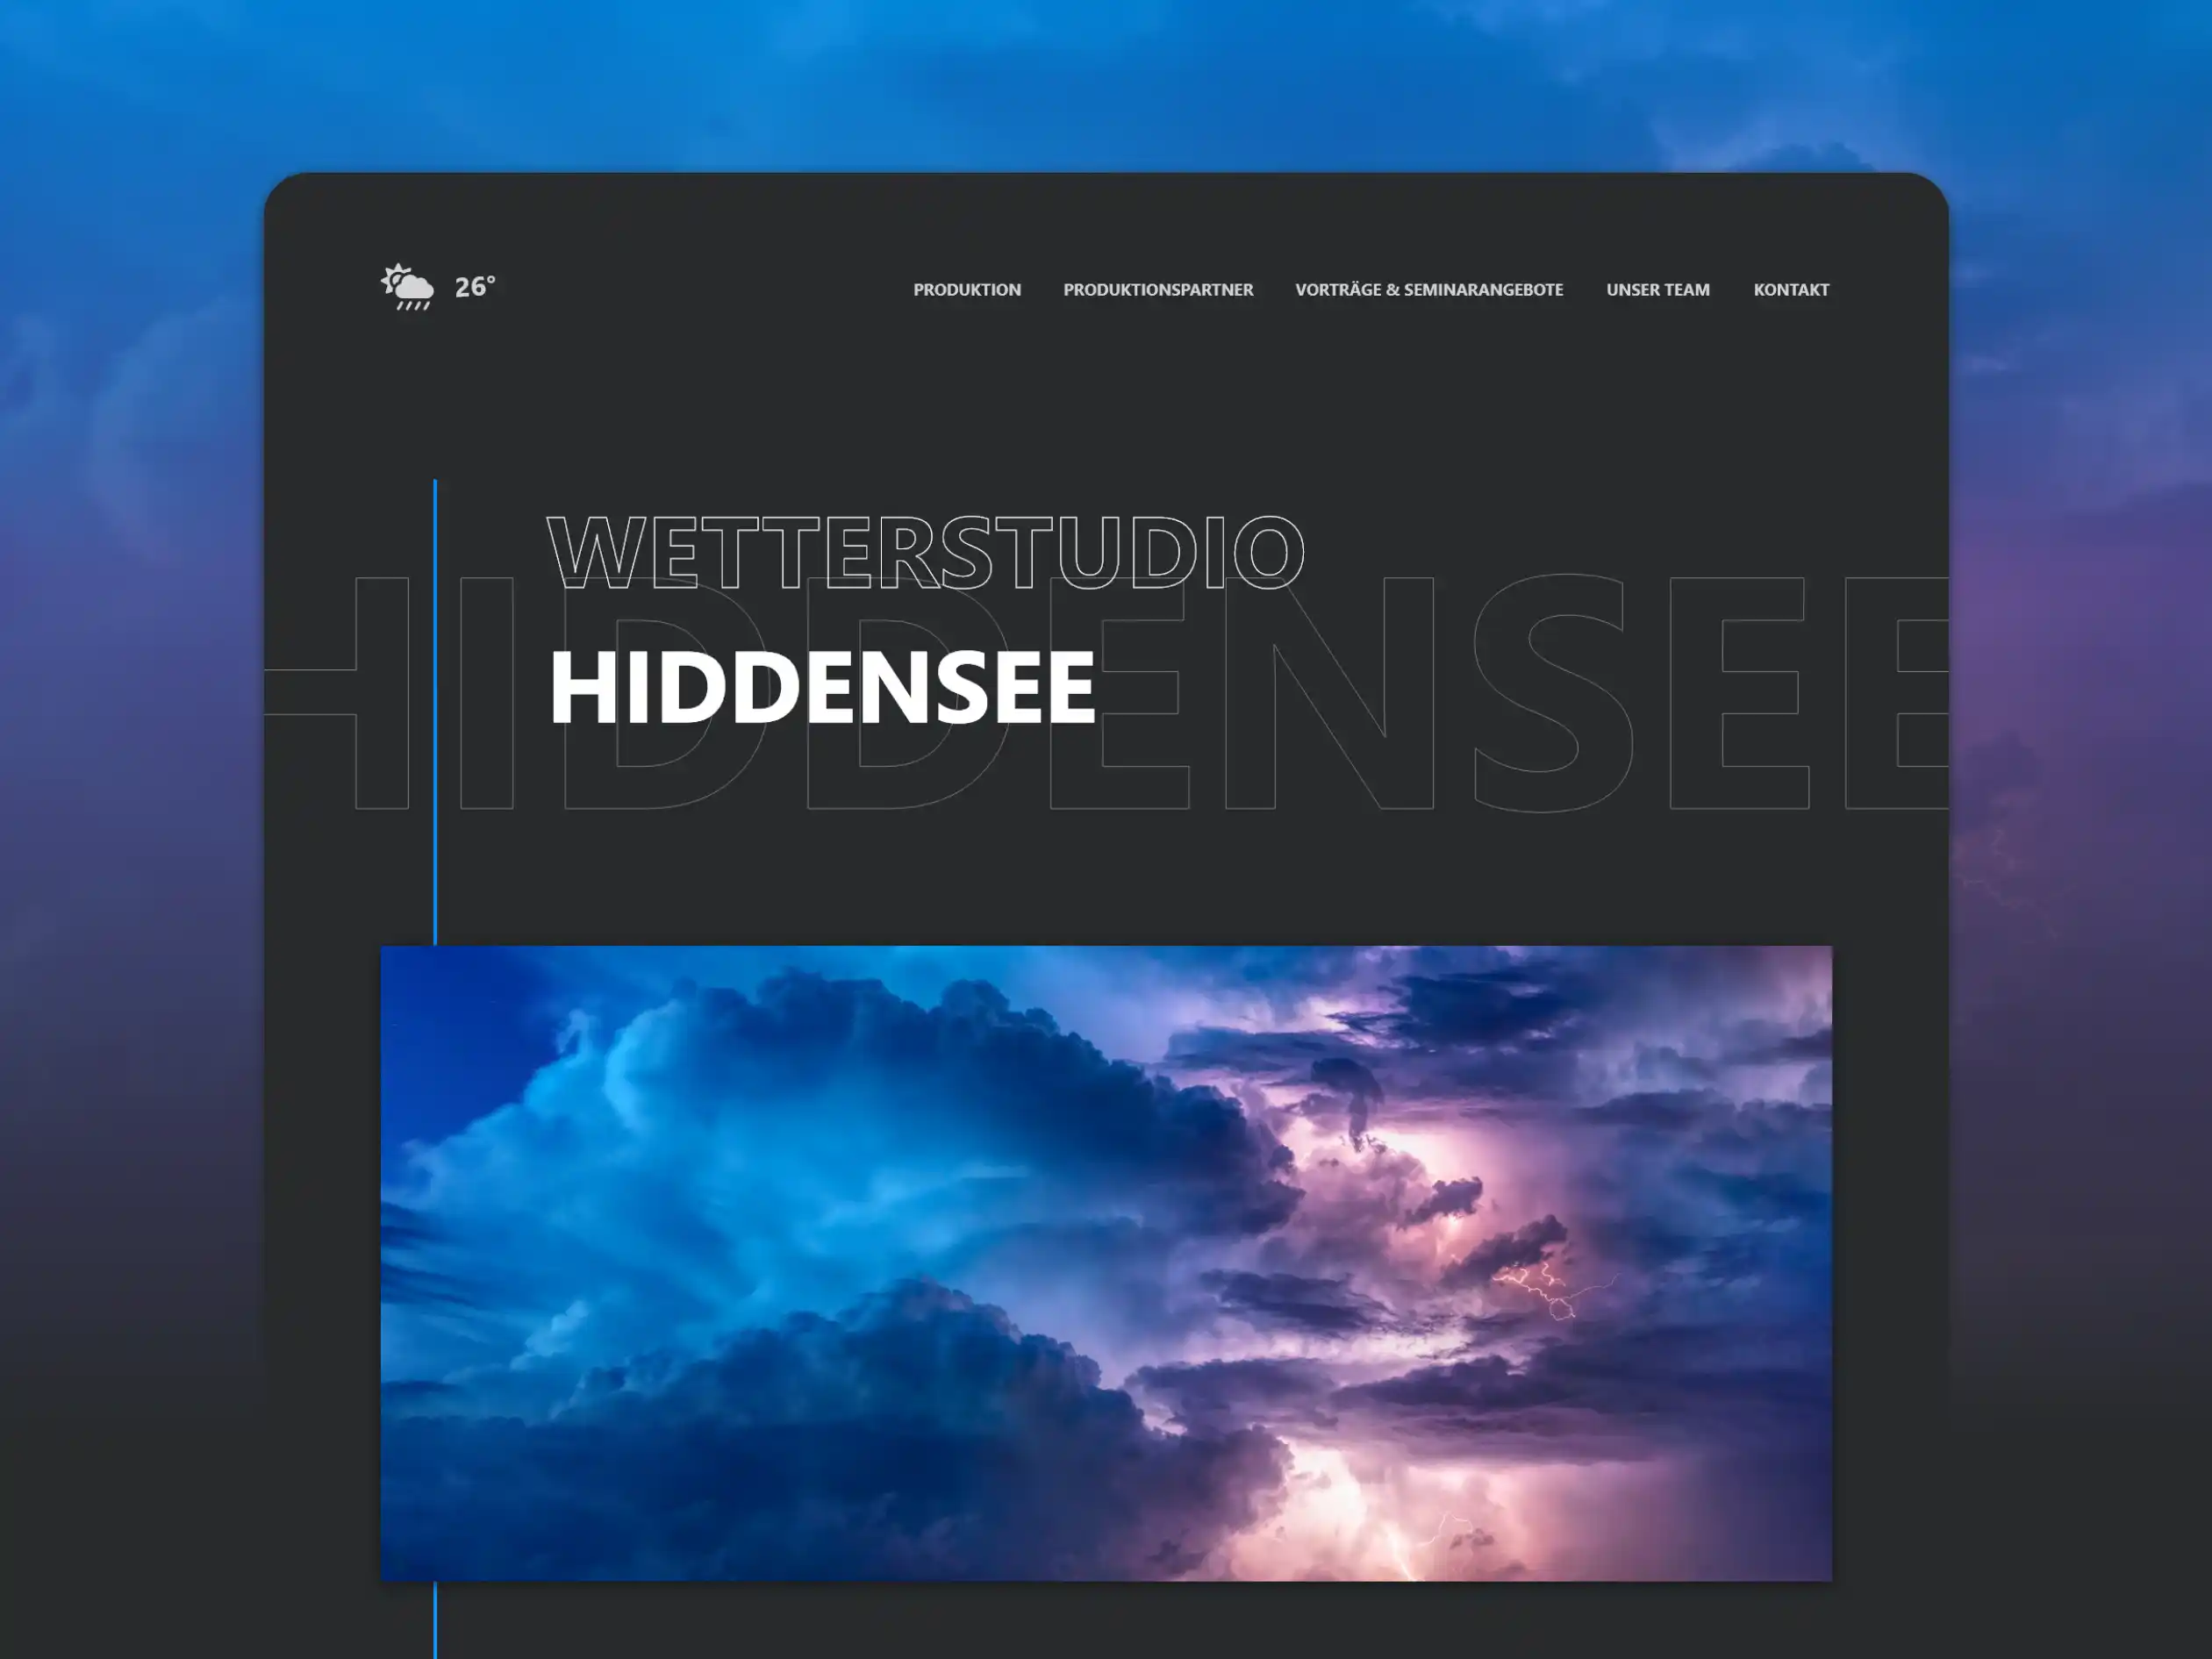
Visual Design
Design Decisions
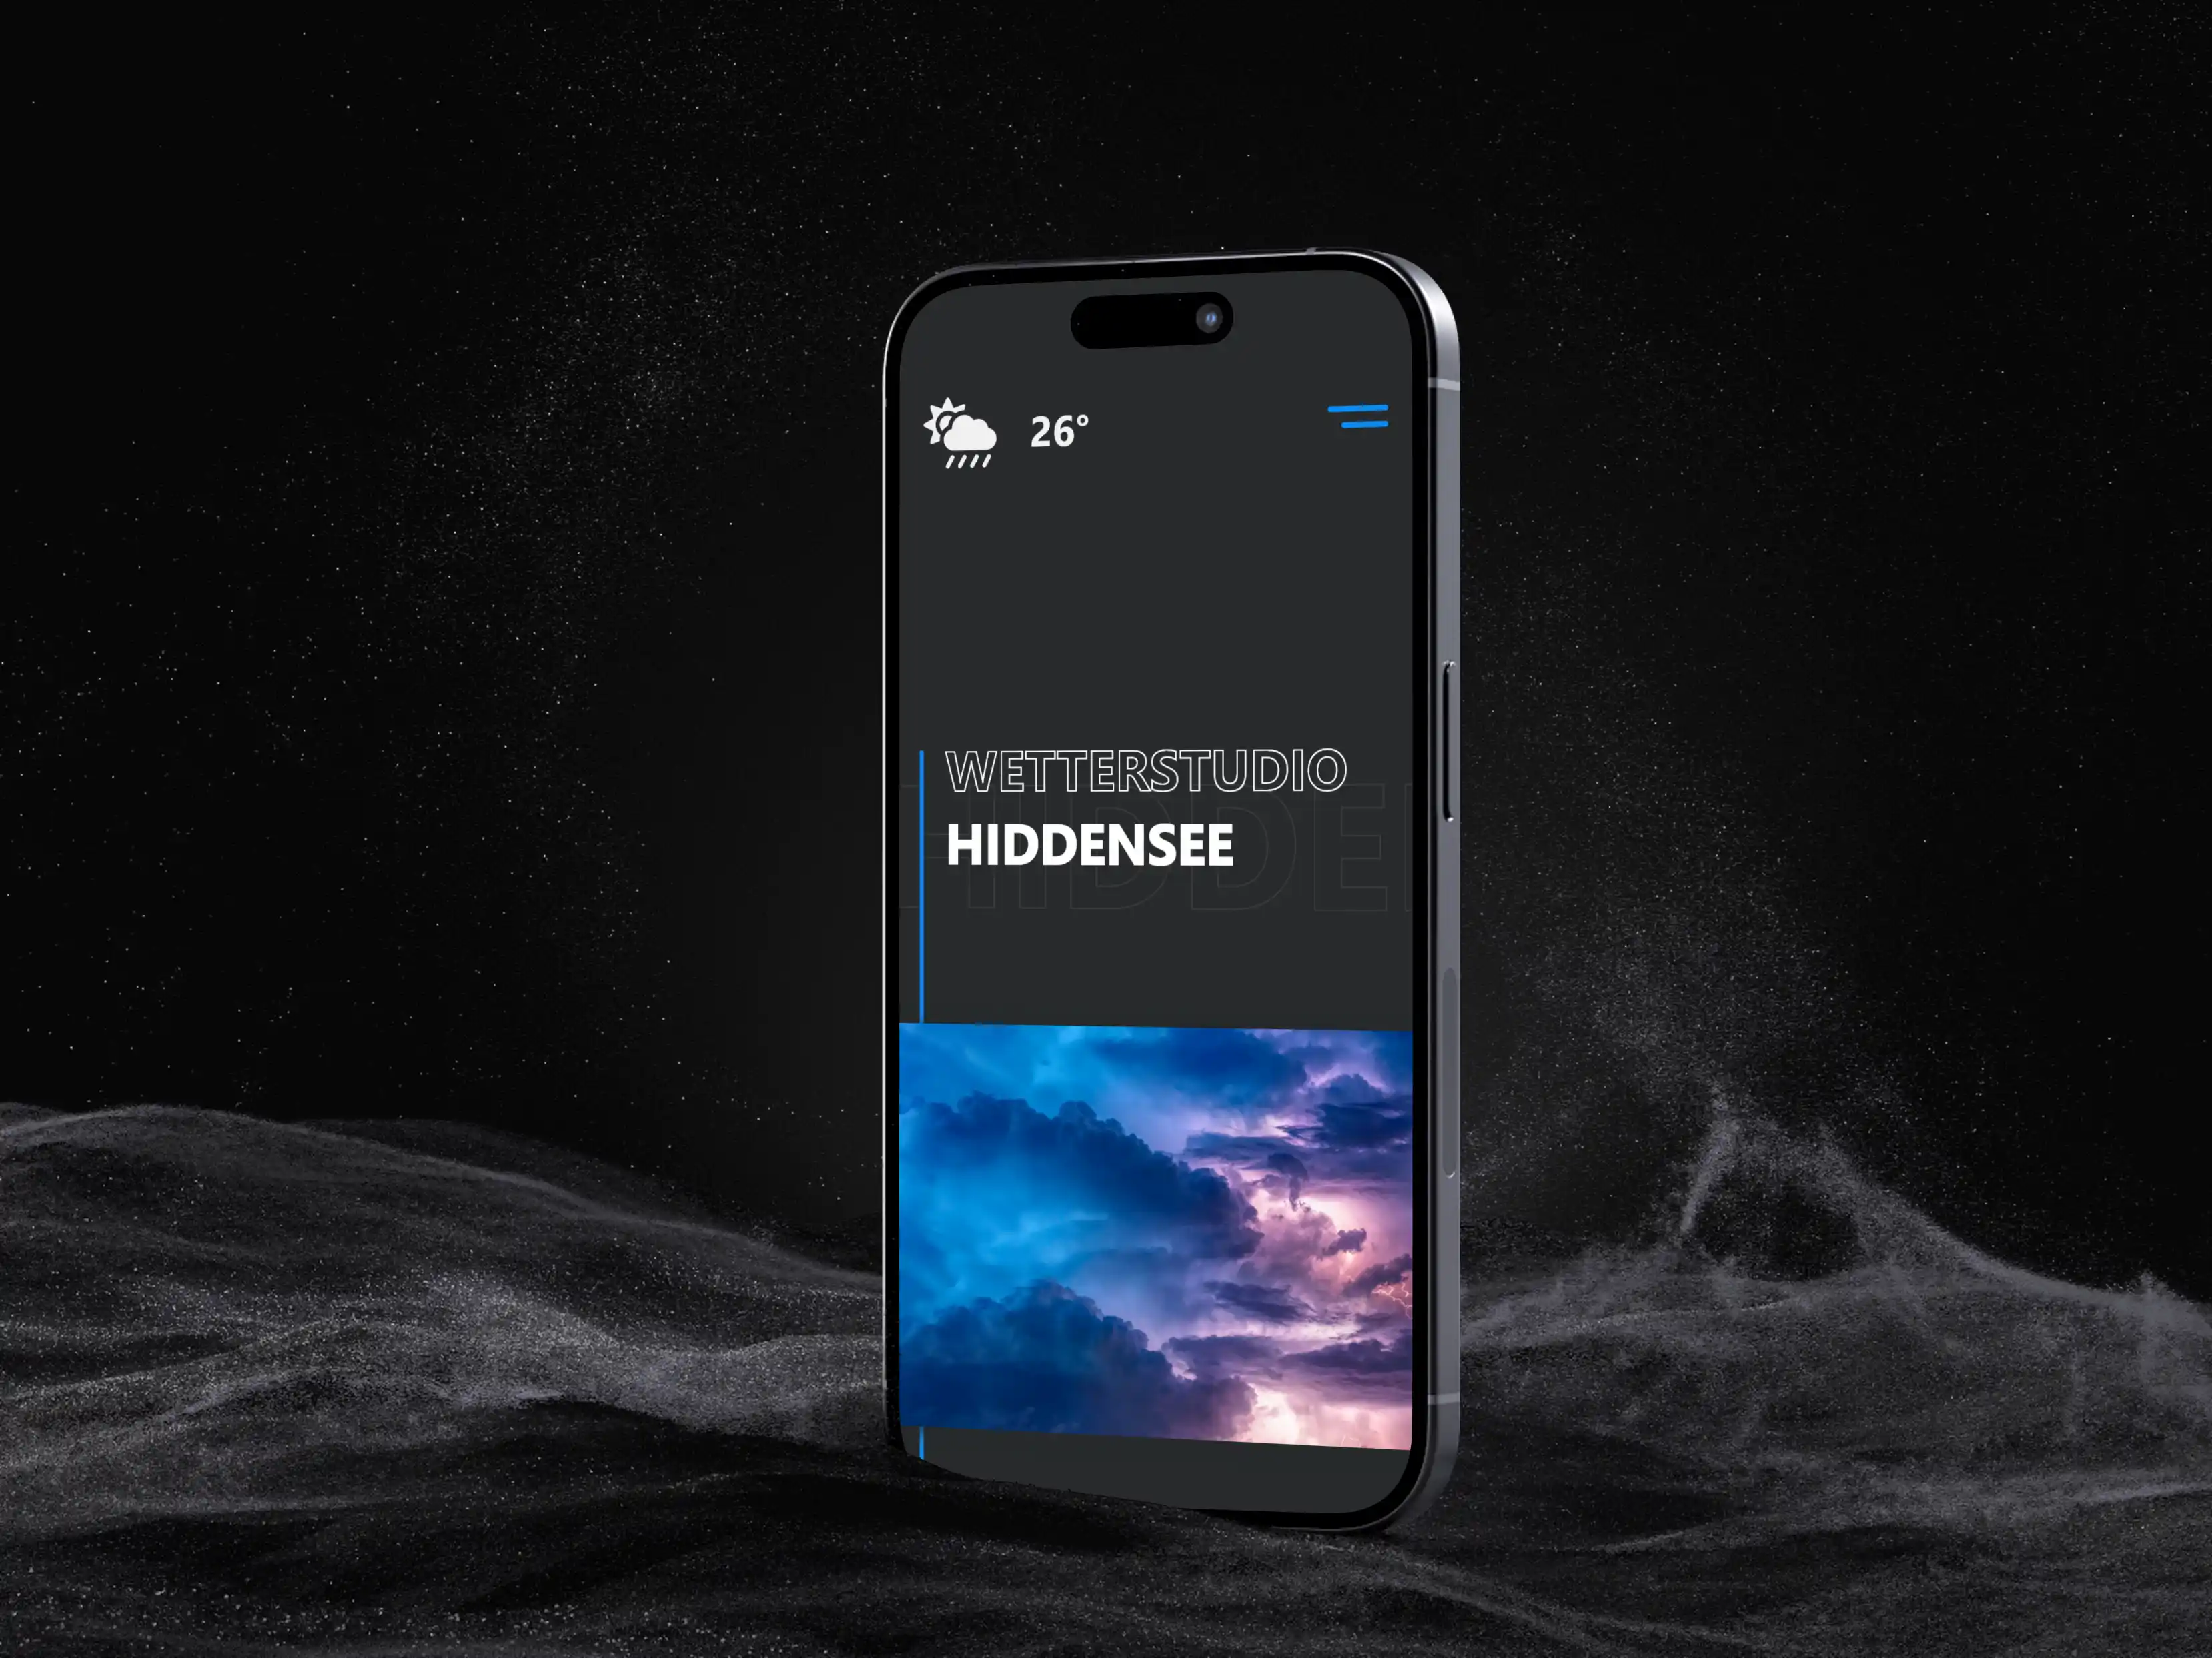
- 01Color scheme that changes with the weather (sun = warm, rain = cool)
- 02Illustrations of the island as background
- 03Clear typography for quick readability
Data Visualization
Information at a glance
- 01Live temperature display prominently in header
- 027-day forecast as timeline
- 03Historical data as interactive charts
Solution
A website that
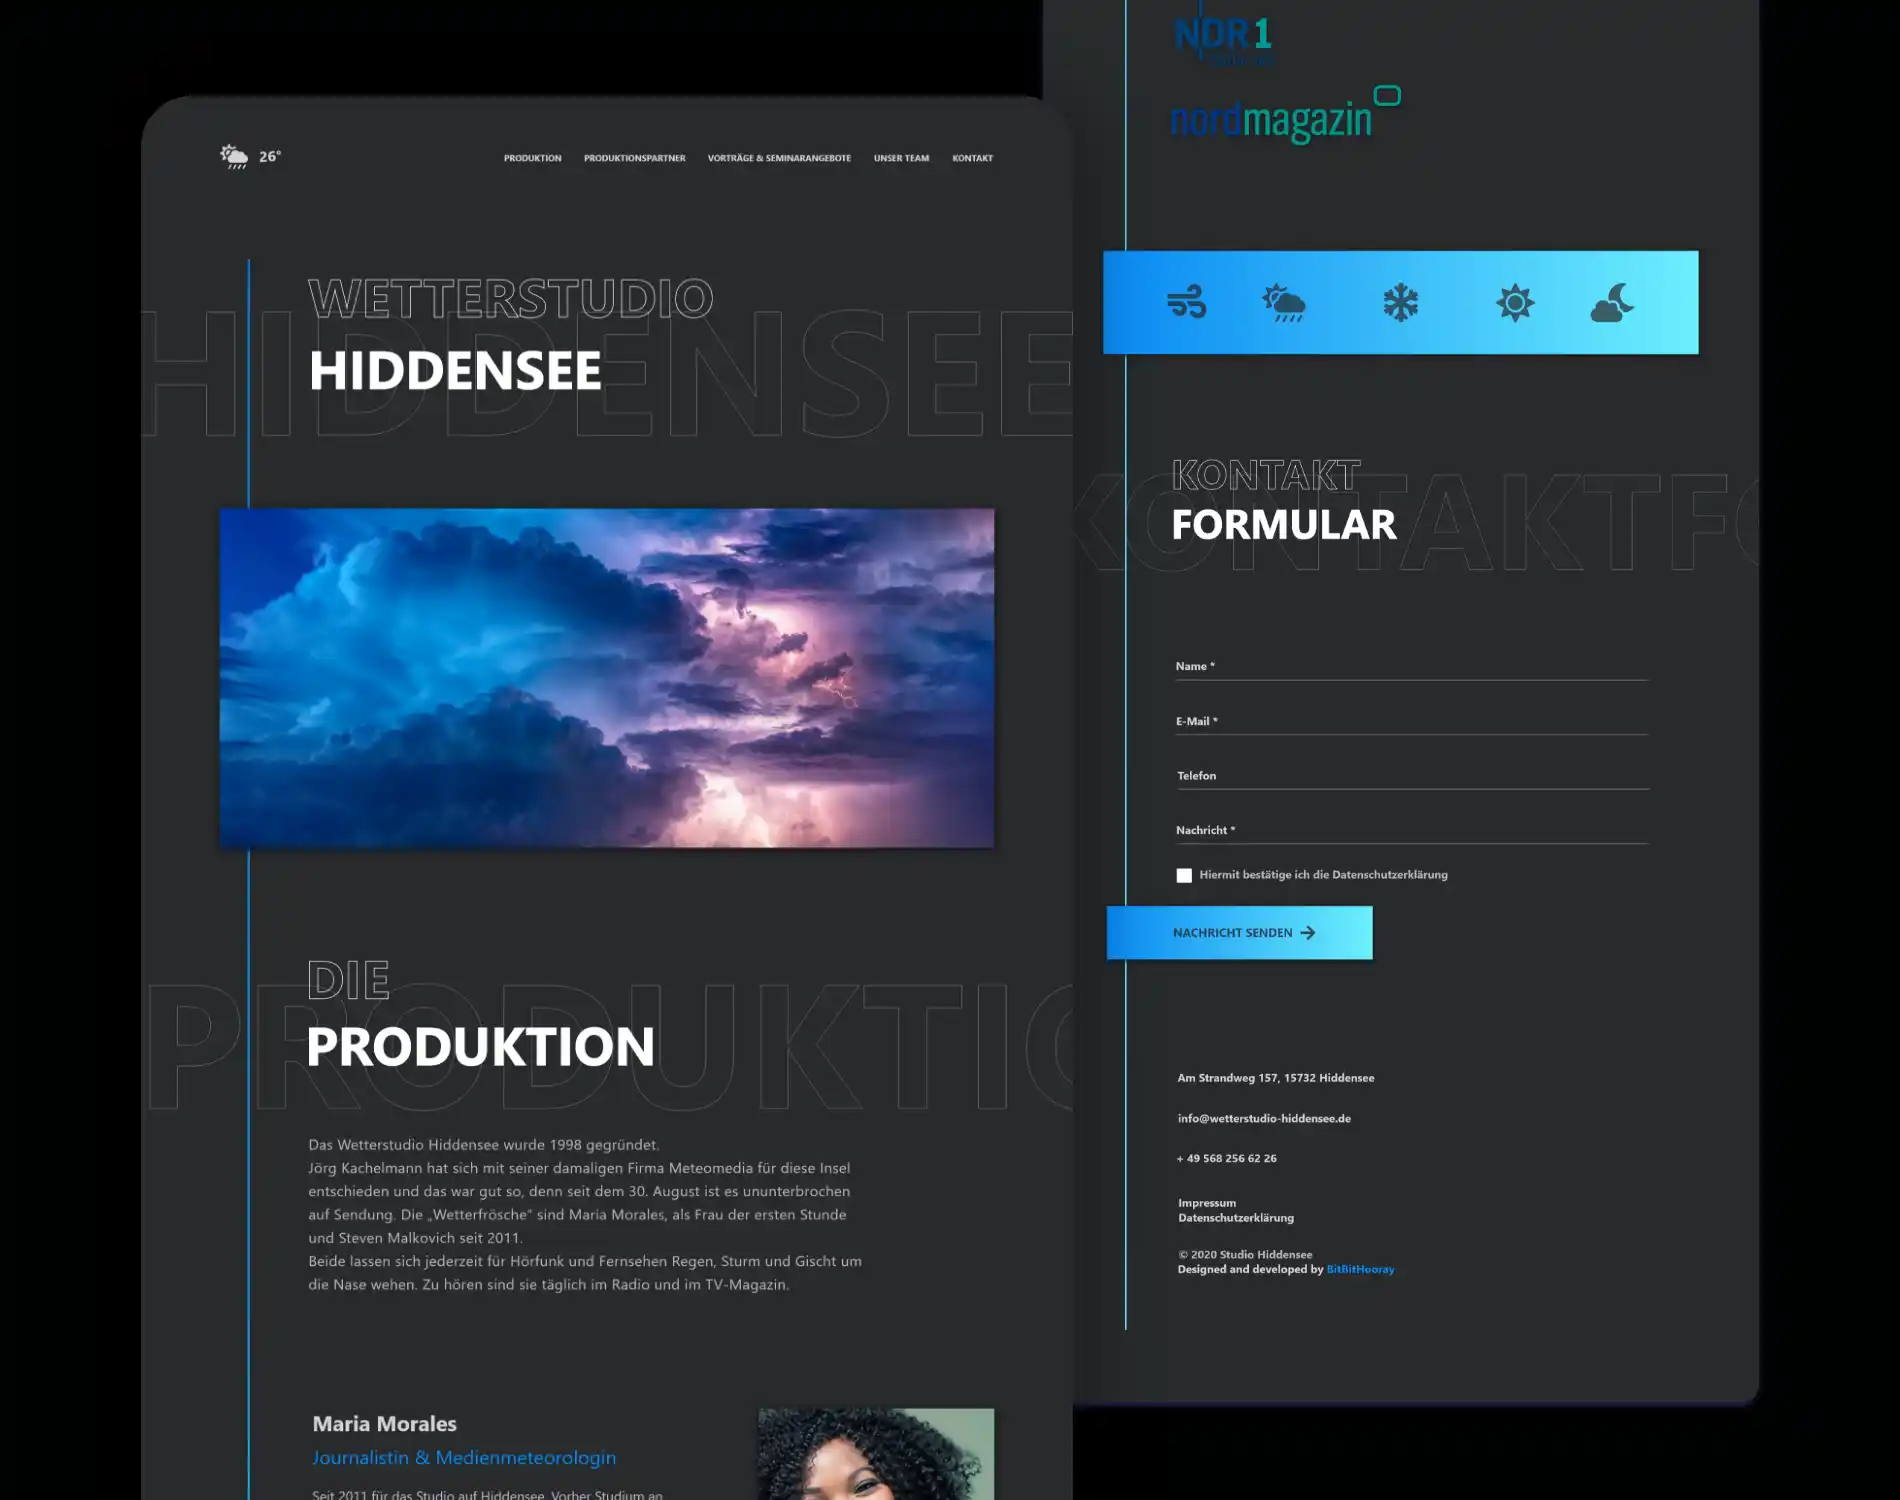
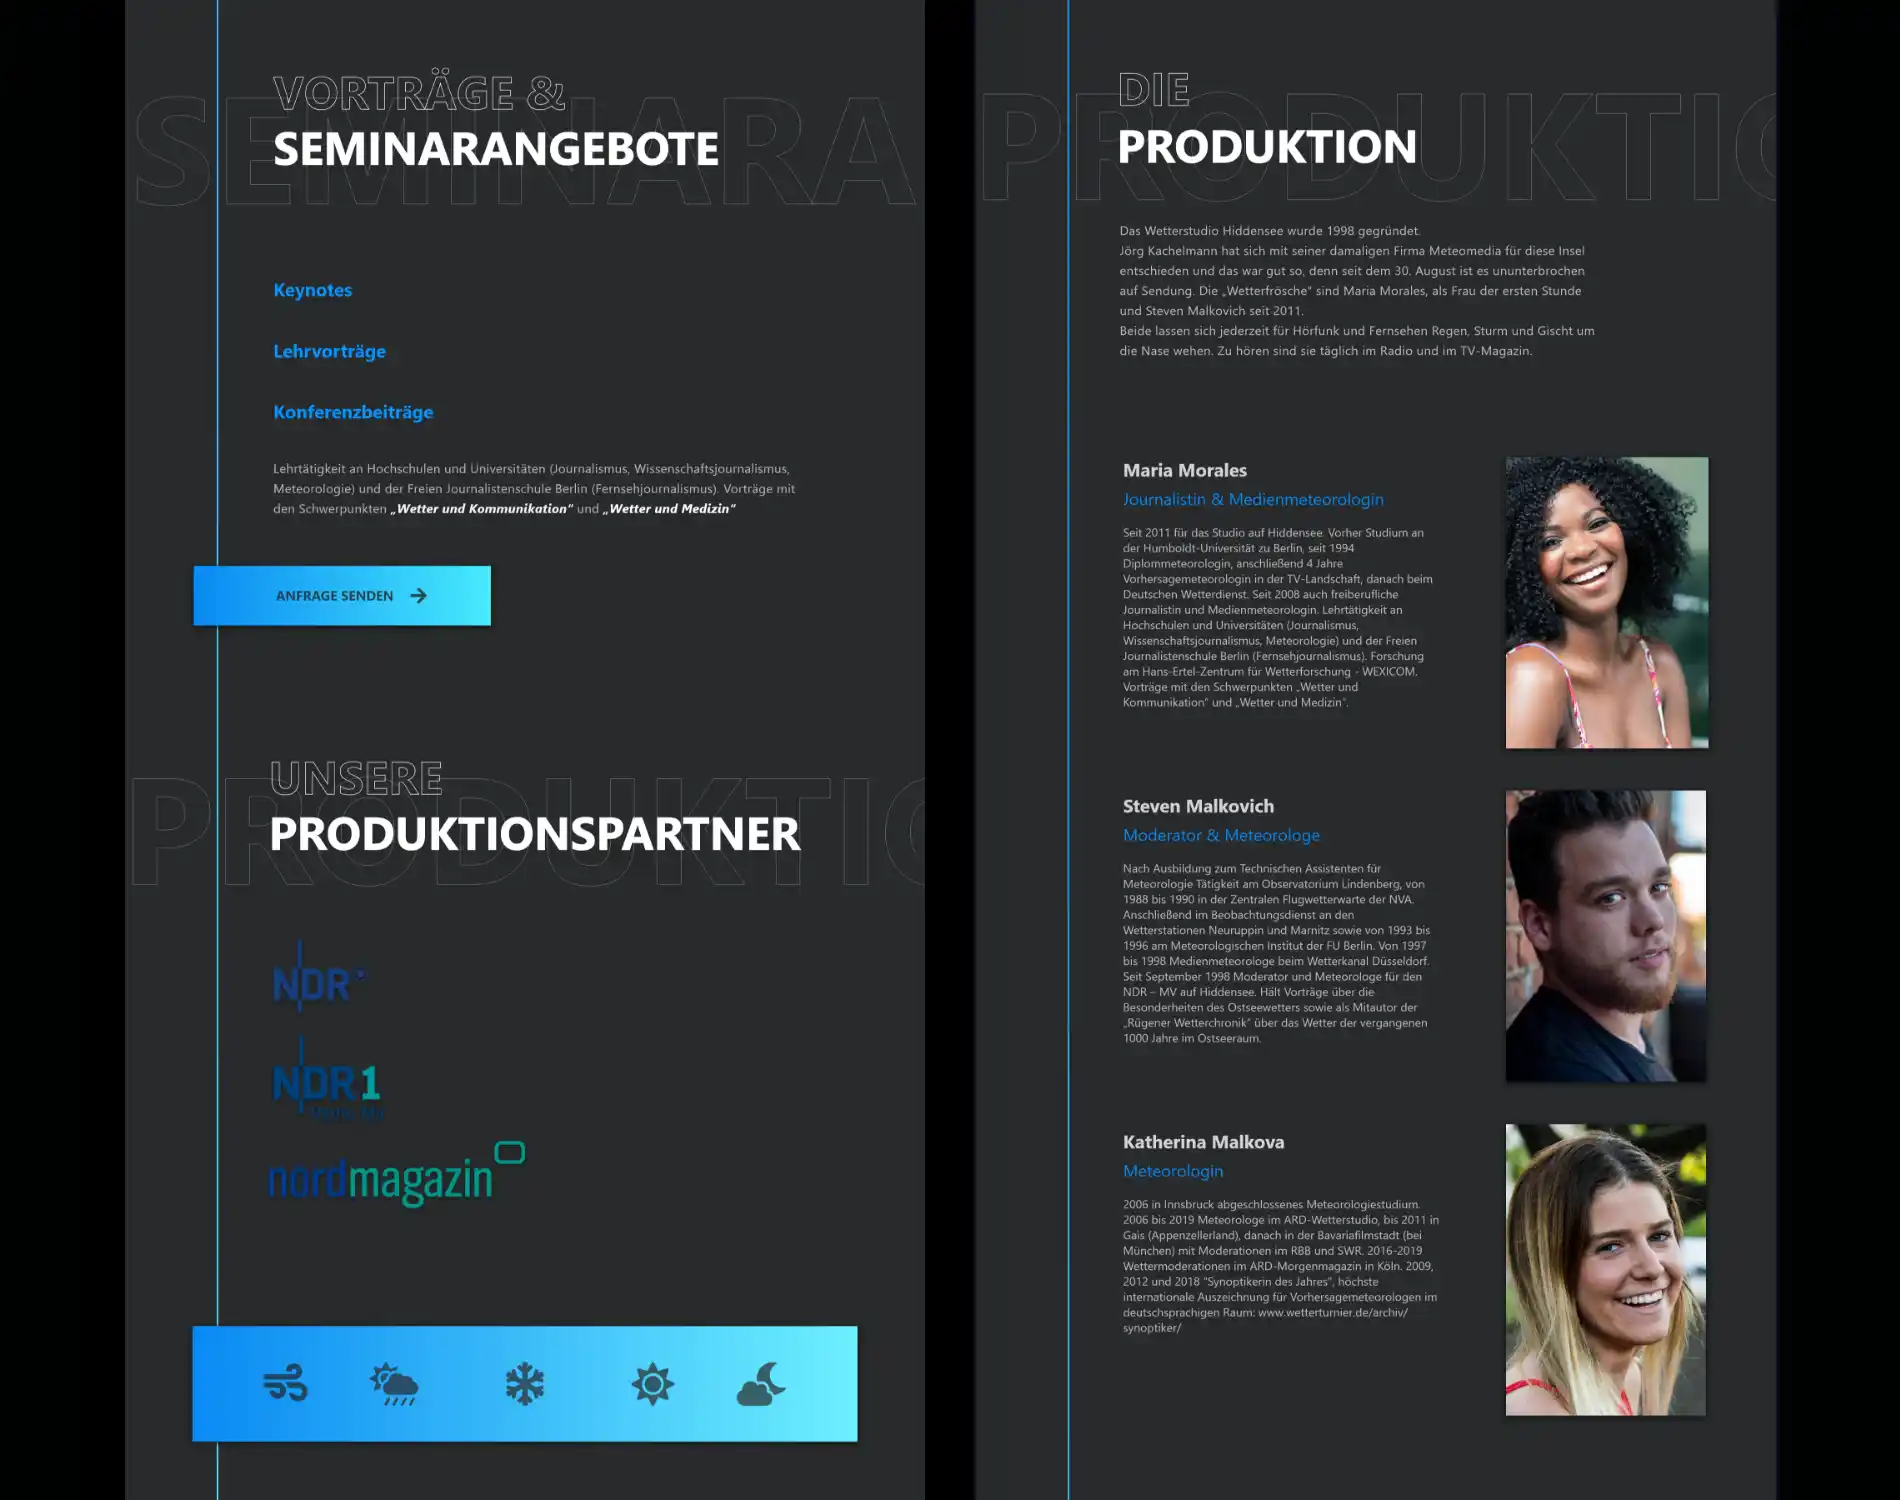
- 01Informs immediately – temperature in hero area
- 02Provides details – wind, precipitation, UV index
- 03Tells stories – blog with weather insights
12kDaily visitors
4.2minAverage time on site
More than just a thermometer
The new site has 12,000 daily visitors – many of them tourists planning their vacation around it. The average time on site of 4.2 minutes shows: People don't just check the thermometer.
ctaBanner.title ctaBanner.titleSecondary
ctaBanner.subtitle